The CRM WebClient UI provides a new dimension of user experience by enabling users without deep technical knowledge to work with the SAP CRM solution. However, the user interface is only the tip of the iceberg — there is a complex software framework underneath it that you might want to explore. Take a look into this complex framework with an introduction to two helpful functionalities: the F2 pop-up window and the conditional breakpoints tool.
Key Concept
The F2 pop-up window provides information about the UI component. For example, it can tell you the UI component BP_ADDR contains the account address and communication data view. It can also tell you the configuration details of a specific UI element, such as the District field in the account address and communication data view. The conditional breakpoints tool helps you identify application and framework issues efficiently. For example, you can use it to find out which database table a specific CRM WebClient UI element refers to, which can be helpful when you are integrating SAP CRM with other systems (e.g., SAP ERP, SAP NetWeaver Business Warehouse, or even third-party software).
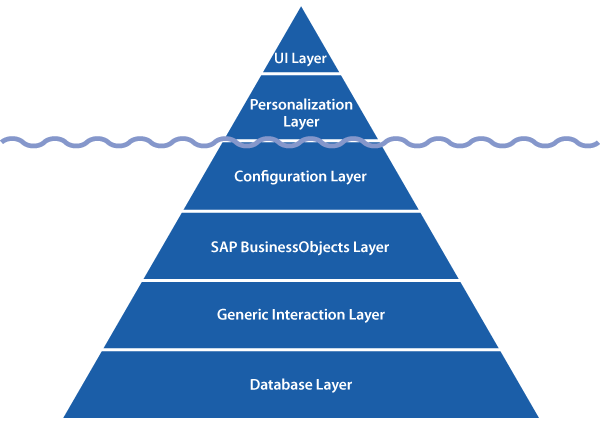
The CRM WebClient UI consists of different layers. Usually, end users only deal with the highest two layers – the user interface layer and the personalization layer. However, there are several other layers that complete the software framework of the CRM WebClient UI and are hidden underneath, similar to the way that the biggest part of an iceberg is concealed underwater. I created a visualization of this comparison in Figure 1.

Figure 1
Analogy between an iceberg and the CRM WebClient UI framework
In this article, I will describe the F2 pop-up window and the conditional breakpoints tool, two of the framework tools you should know about before you take a deep dive into the underlying layers of the CRM WebClient UI. I will guide you through some of the technical details as well.
F2 Pop-Up Window
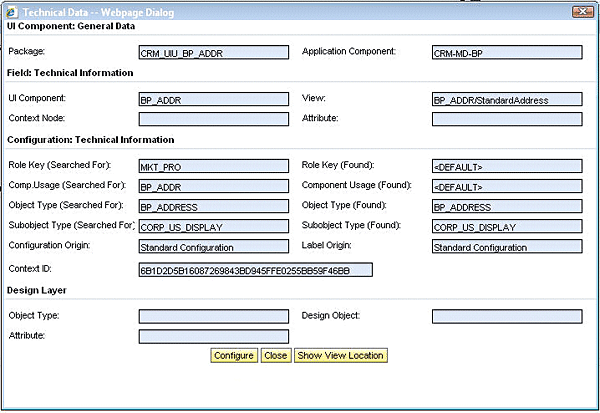
You can use the F2 pop-up window to analyze information about the CRM WebClient UI component and the configuration details of a specific UI element. To open the F2 pop-up window, highlight the UI element you are interested in and press the F2 hotkey (Figure 2). Figure 3 shows the F2 pop-up window filled with helpful information such as UI component general data, technical data, configuration data, and design layer data.

Figure 2
How to open the F2 pop-up window

Figure 3
Example of an F2 pop-up window for the selected field District
You must enable configuration mode in your central personalization settings to see the Configure button in addition to the standard buttons Close and Show View Location at the bottom of the pop-up window. In Figure 2, I highlighted the District field with the value New York on the UI. Using the F2 pop-up window, you can easily find out that this field belongs to the UI Component BP_ADDR and the view StandardAddress. When you click the Configure button, the configuration of this view is displayed in the configuration tool.
To locate this view in the UI hierarchy, click the standard Show View Location button. A popup similar to Figure 4 appears. By clicking the link for each view, you can traverse through the UI hierarchy tree, display the details of each view, and configure the view if necessary.

Figure 4
View Location pop-up window with UI hierarchy tree
With the F2 pop-up window, you can analyze the upper three layers of the CRM WebClient UI framework. Next, I will tell you more about the conditional breakpoints tool, which is helpful for analyzing the lower layers of the CRM WebClient UI.
Conditional Breakpoints Tool
The conditional breakpoints tool, in combination with the ABAP debugger, helps users analyze application and framework issues in a more efficient way by providing a standard user interface to set breakpoints in predefined places in different framework layers (e.g., the business object layer and the generic interaction layer). It is also a powerful tool for finding out where the application data is stored, which can be helpful when you integrate SAP CRM with other systems such as SAP ERP, SAP NetWeaver Business Warehouse (SAP NetWeaver BW), or third-party software. You can follow the three simple steps below to enable the conditional breakpoints tool.
Step 1. Use transaction SAAB to activate the checkpoint group CRMUIF_CONDITIONAL_BREAKPOINTS for your user by clicking the activate icon (Figure 5).

Figure 5
Enable checkpoint group CRMUIF_CONDITIONAL_BREAKPOINTS
You are taken to the Activate Checkpoint Group screen (Figure 6). In the Activation tab, make the Personal Activation settings by selecting the following radio buttons: Break under the Breakpoints block, Log under the Logpoints block, Break under the Assertions (Foreground) block, and Log under the Background Processing block. These changes are active only after you click the save icon or press Ctrl+S.

Figure 6
Activate checkpoint group for your user
Step 2. The conditional breakpoints tool requires external debugging as a prerequisite. Go to transaction START_BSP, enter CRM_UI_START as the BSP application, and enable external/http debugging by checking the External Debugging On check box as shown in Figure 7. You can start the CRM WebClient UI with external/http debugging activated by pressing F8 or clicking the execute icon.

Figure 7
Transaction START_BSP starts the CRM WebClient UI
As an alternative, you can also manually enable external debugging in the ABAP editor. Go to transaction SE80, and in the top menu bar, navigate to Utilities > Settings. The User-Specific Settings screen opens; select the ABAP Editor tab and then the Debugging tab. Enter your user information and press the Enter key or click the transfer icon (Figure 8).

Figure 8
Enable external debugging for a specific user
Next, go to the Repository Browser on the left side of the Object Navigator (the second item shown in Figure 9). Select BSP Application in the first drop-down list on the left, enter CRM_UI_START as the value in the second field, and press the Enter key. Open the Pages with Flow Logic folder and double-click default.htm. After the default.htm page is displayed on the panel on the right, go back to the menu bar and select Utilities > External Breakpoints > Activate/Deactivate. After you do this, you can start the CRM WebClient UI directly by pressing F8 or by right-clicking default.htm and selecting Test (Figure 10).

Figure 9
Activate external breakpoints on the ABAP Editor

Figure 10
Right-click default.htm to start CRM WebClient UI
Step 3. Open the conditional breakpoints window with the keyboard combination Alt+F2 and set your breakpoints (Figure 11). Breakpoints can be set on the Business Object Layer, Business Object Layer - Entity Manager, Design Layer, Generic Interaction Layer, and many other predefined places that you choose from a drop-down list.

Figure 11
Conditional breakpoints window
Here is a practical example of how to use the conditional breakpoints tool. Figure 12 shows the details of a service order. Imagine that you are working on an integration project between SAP CRM and SAP NetWeaver BW and need to know the origin and the technical details of the Requested Start date field. The conditional breakpoints tool allows you to extract the data of this field by extending the standard extractor because not all the fields are provided in the standard extractor.

Figure 12
Service order example
You can use the conditional breakpoints tool to set a breakpoint at the Generic Interaction Layer at the event Container Object - Get Attributes (*) and enter the value 07.11.2010 (Figure 13), which is the requested start date of the service order. After activating the breakpoint, the ABAP debugger starts automatically when the specified value (in this case, 07.11.2010) is retrieved from the backend and you can debug the Generic Interaction Layer of the Requested Start date UI element.

Figure 13
Example of how to use conditional breakpoints
You can also use the conditional breakpoints tool to drill down from the generic interaction layer (the fifth layer of the hierarchy from Figure 1) to the lowest and sixth layer, the database layer. To debug this layer, you can use the same debugging approach that I described above. However, note that there is no generic or standard way to find the respective database table because each generic interaction layer has a different implementation.
Hena Mau
Hena Mau is a software developer for Business Suite UI Framework at SAP. She has been with SAP for four years, specializing in SAP CRM and Web User Interface technology.
You may contact the author at hena.mau@sap.com.
If you have comments about this article or publication, or would like to submit an article idea, please contact the editor.

