Meet the Authors
Key Takeaways
-
Depending on company size, thousands of data points and transactions enter SAP systems every day.
-
SAP Fiori LaunchPad provides a convenient user experience interface for SAP applications, and many organizations are familiar with the technology.
-
Arch Consulting has created an initiative that enhances SAP Fiori LaunchPad by turning it into a dashboard.
Insights from data drive business success by enabling stakeholders to choose the right course of action and contribute to informed decision-making. From day-to-day operations to pivotal and strategic decisions that shape a company’s future, data and insights play a vital role.
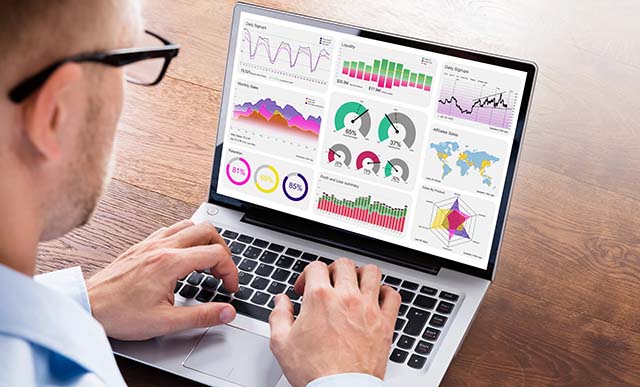
Depending on company size, thousands of data points and transactions enter SAP systems every day. These can yield a lot of valuable information, but the challenge is often in finding ways to consume or present that information. Dashboarding is a useful way of viewing insights in an infographic and consolidated manner. It also enables standardized reporting, as it can serve as a single source of truth. Dashboarding can also save time by reducing the need to frequently create ad hoc reports.
Dashboarding in SAP Fiori LaunchPad
Explore related questions
SAP Fiori LaunchPad provides a convenient user experience interface for SAP applications, and many organizations are familiar with the technology. Arch Consulting has created an initiative that enhances SAP Fiori LaunchPad by turning it into a dashboard.
The analytics on SAP Signavio and SAP Fiori overview pages are valuable but cannot be used directly for business. Arch’s solution addresses this need with an add-on product called Tilebuilder. The user-friendly add-on enables the creation of dynamic tiles that display real-time insights and turn the LaunchPad into an informative analytics display. With Tilebuilder, the app’s usage extends beyond grouping functions and serves as a repository of information. Images can also be added to these tiles to make the interface more appealing.
As useful as it could be, not all functionality is included in the Overview pages of the LaunchPad. To ensure clarity, Tilebuilder uses an efficient interface where users have the option to see Overview Page as their Home or add a dashboard into LaunchPad pages. All tiles can be modified together or in gradual increments to display graphs, charts or KPIs. This is a very powerful method for organizations to be informed continually about status-quo by their data and make informed decisions.


